Benchmarks
What Baysor cpp-0.9.0 segmentations look like on benchmark crops of four platforms, and how cleanly the cells separate neighbouring cell types. Run time and memory are on the Profiling page.
What the segmentations look like
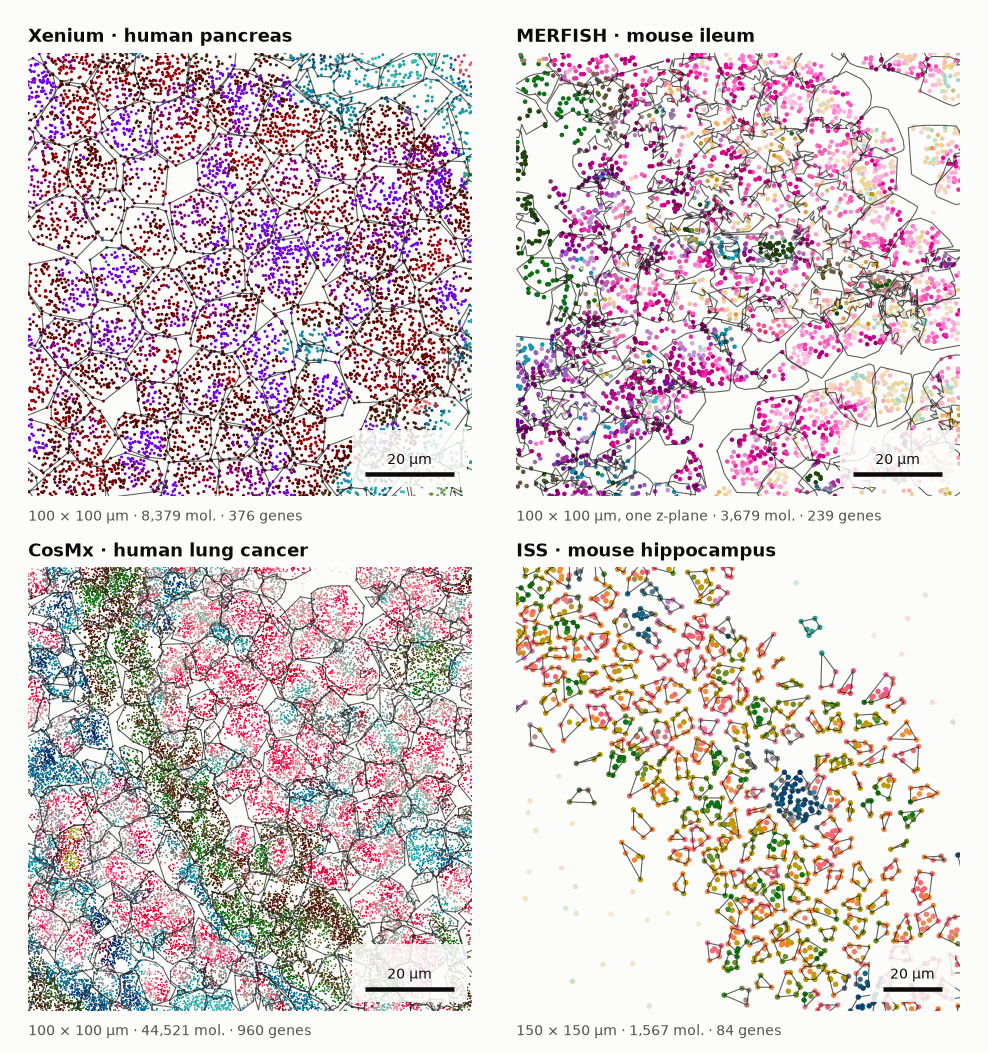
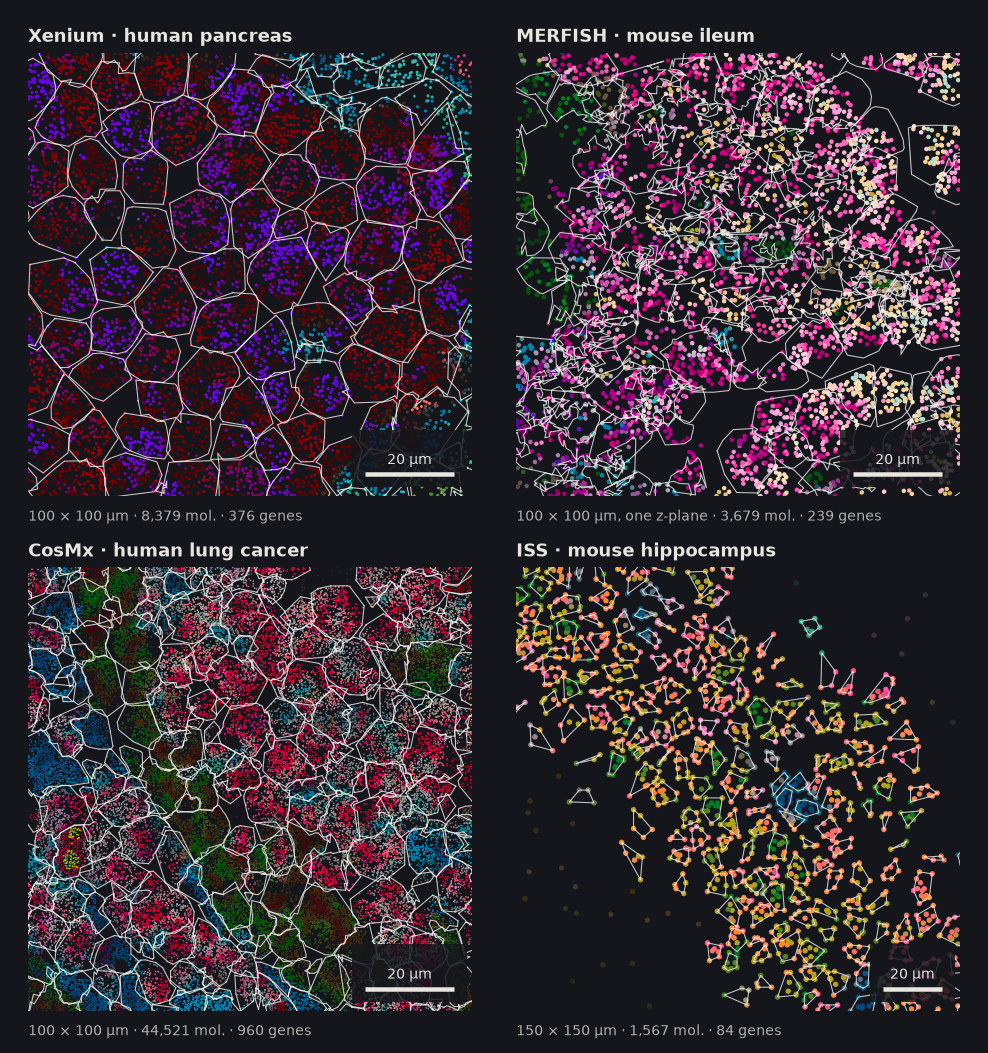
Figure 1. cpp-0.9.0 segmentations of four platforms. Each panel is the
densest 100 × 100 µm window of a benchmark crop (150 × 150 µm for the sparse
ISS data). Molecules are coloured by Baysor's neighbourhood-composition colours
(NCV colours, the ncv_color column of the molecule output): molecules with a
similar gene composition around them get similar colours, so cell types show
up as colour groups. Noise molecules are muted, and the lines are Baysor's
cell polygons. MERFISH is 3-D: the molecules of one z-plane are shown with the
outlines of the cells that have at least 8 molecules in it; neighbouring 3-D
cells can overlap in this projection. The four runs repeat the benchmark
runs with the NCV colours on, which leaves the segmentation unchanged.
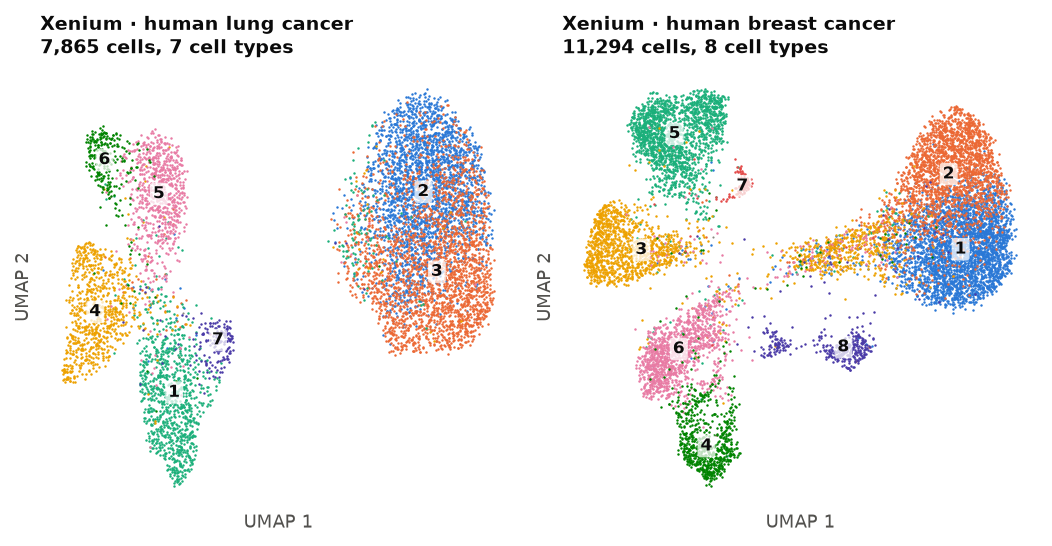
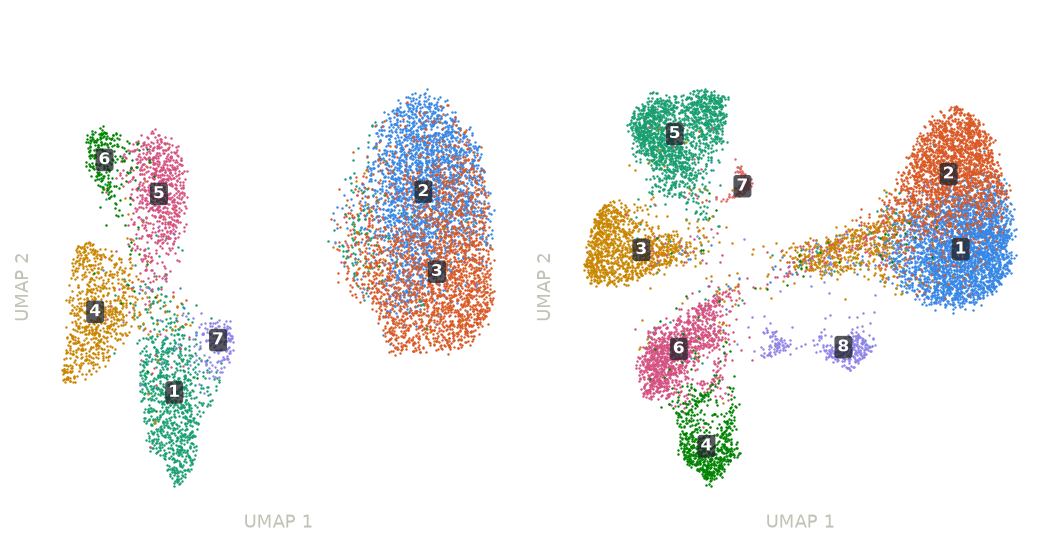
Figure 2. UMAP of the cells segmented by cpp-0.9.0 on two Xenium crops, computed from the cell × gene count matrix (normalised, log-transformed, 30 principal components). Colours and numbers are the cell types used by the cellAdmix audit below (transferred from a reference segmentation of the same crop); grey cells could not be typed.
Figure 3. Admixture measured with cellAdmix: the share of molecules in a cell that leaked in from a neighbouring cell of another type (lower is cleaner). Top: total rate per real dataset with at least 2,000 cells, cpp-0.9.0 (filled) and cpp-0.8.3 (open), mean of the replicates of the release benchmark (same command lines for both versions; see the measurement setup). Bottom: the eight largest source → target cell-type pairs on the 550k Xenium lung crop; the type numbers are those of Figure 2 (left). The two versions are close on every dataset. On all five 550k-molecule crops built for this audit cpp-0.9.0 is slightly cleaner, e.g. 5.3 % vs 5.4 % on the Xenium lung crop; the 130k Xenium Prime 5K crop goes the other way (3.7 % vs 3.4 %).
Reproduce
The figures are regenerated from the benchmark results by
docs_figures/make_figures.py
in baysor-benchmarks, after docs_figures/ncv_runs.py has re-run the four
example crops with the NCV colours on; docs_figures/generated/tables.md
there lists the source file of each number. To benchmark your own build, see
Development › Benchmarks.